Anti-tumor Activity of Schoenoplectus triqueter Extract by Suppressing the STAT3 Signaling Pathway in A549 Lung Adenocarcinoma Cells
Abstract
Many plant extracts have been recognized for their potential anti-cancer properties. Schoenoplectus triqueter (L.) Palla, commonly known as triangular rush (TAR) and part of the Cyperaceae family, predominantly thrives in the wetlands of the Huangpu Yangtze estuary. In this study, we explored the anti-cancer capabilities of TAR on lung cancer A549 cells. Our findings revealed that TAR was significantly more cytotoxic to A549 cells than to normal lung HEL 299 cells. TAR promoted apoptosis through enhanced caspase-3 activity and subsequent cleavage of poly ADP ribose polymerase (PARP). This apoptotic effect was associated with the downregulation of several STAT3-regulated genes, including Survivin, IAP-1, Cyclin D1, COX-2, and matrix metallopeptidase 9 (MMP-9). Moreover, TAR effectively reduced cell proliferation, invasion, and migration. The inhibition of STAT3 activation was achieved by blocking the upstream Janus activated kinases 1 and 2 (JAK1, JAK2), c-Src kinases, and the nuclear translocation of STAT3 in A549 cells. Additionally, TAR enhanced the effects of cisplatin through synergistic inhibition of STAT3 activation and increased apoptosis in A549 cells. Key compounds contributing to these biological activities were identified via LC-HRMS analysis. Our results suggest that TAR blocks constitutive STAT3 activation, exhibiting anti-proliferative and pro-apoptotic effects in lung cancer A549 cells.
Keywords:
Schoenoplectus triqueter, STAT3, Apoptosis, Lung cancerIntroduction
Lung cancer is one of the most commonly leading cause of cancer-related death in the world.1–3 It is primarily divided into two major histological categories: non-small cell lung cancer (NSCLC) and small cell lung cancer (SCLC). NSCLC is the predominant form, comprising over 80% of lung cancer cases.1,2 Traditionally, the mainstay of NSCLC treatment has been surgical resection combined with chemoradiotherapy.2 Cisplatin is a typical chemotherapeutic agent in the treatment of lung cancer.4 However, conventional chemotherapy often lacks specificity and can cause severe side effects in patients.2,4 In order to develop novel treatment and strategies for NSCLS, a better understanding of molecular targets and mechanisms is essential. Recent advances in targeted therapies and immunotherapies have shown promise, but there is still a significant need for novel therapeutic agents.
Signal transducer and activator of transcription 3 (STAT3) is an oncogenic transcription factor that activated in various human cancer cells.5–7 STAT3 can modulate many critical functions including cell proliferation, differentiation and apoptosis in tumor cells. Activation of STAT3 stimulated by diverse cytokines induces dimerization, nuclear translocation, DNA binding, and subsequent gene transcription.8 The phosphorylation of STAT3 is mediated through the activation of non‐receptor protein tyrosine kinases called Janus‐like kinase (JAK). JAK1, JAK2, JAK3, and TYK2 have been implicated in the activation of STAT3.9,10 In addition, the role of c‐Src kinase has been demonstrated in STAT3 phosphorylation. Expression of the various gene products required for tumorigenesis can be induced by STAT3 phosphorylation such as apoptosis inhibitors (Bcl-xL, Bcl-2, and survivin), cell-cycle regulators (Cyclin D1), and inducers of metastasis (MMP-9 and COX-2).9–12
S. triqueter (L.) Palla [common name: triangular rush (TAR)], belongs to Cyperaceae, and mainly grows in wetland of Huangpu Yangtze estuary.13–15 It produces about 100 cm tall trigonous stems and leafless sheaths below.13,14 The uppermost layer has usually short lamina and the glumes are between 3.4 and 4 mm.16 Although the anti-cancer and anti-inflammatory properties of TAR extracts have not been widely explored, this study focuses on its anti-cancer effects through the modulation of the STAT3 signaling pathway in human lung cancer cells. Our results indicate that TAR down-regulates constitutive STAT3 activation and the expression of cell survival, proliferative gene products, leading to suppression of proliferation, induction of apoptosis. Moreover, TAR enhances both cytotoxic and apoptotic effects of cisplatin in A549 cells. These findings suggest that TAR could be a potential therapeutic agent for enhancing the efficacy of existing chemotherapy treatments.
Experimental
Reagents – TAR was purchased from International Biological Material Research Center (Daejeon, Korea). TAR was obtained by extracting the S. triqueter (L.) Palla with one or more solvents selected from the group consisting of water, alcohols with 1 to 4 carbon atoms, and their mixed solvents. 3-(4,5-dimethylthiazol-2-yl)-2,5-diphenyltetrazolium bromide (MTT) and bovine serum albumin (BSA) were purchased from Sigma-Aldrich (St. Louis, MO). Alexa Fluor® 488 donkey anti-mouse IgG (H+L) antibody and Fluor® 594 donkey anti-rabbit IgG (H+L) antibody was obtained from Life Technologies (Grand Island, NY). LightShift® Chemiluminescent EMSA kit were purchased from Thermo Fisher Scientific Inc. Anti-phospho-STAT3(Tyr705), anti-phospho-JAK1 (Tyr1022/1023), anti-JAK1, anti-phospho-JAK2 (Tyr1007/1008), anti-JAK2, anti-phospho-Src (Tyr416), anti-Src, anti-Procaspase-3, anti-Cleaved caspase3, and anti-Cyclin D1 antibodies were purchased from Cell Signaling Technology (Beverly, MA). Anti-STAT3, anti-PARP, anti-Survivin, anti-IAP-1, anti-COX-2, anti-MMP9, and anti-β-actin antibodies were purchased from Santa Cruz Biotechnology (Santa Cruz, CA).
Cell culture – Human lung carcinoma A549 cells and human lung fibroblast HEL 299 cells were obtained from the American Type Culture Collection (Manassas, VA, USA). A549 cells was cultured in Dulbecco’s Modified Eagle Medium (DMEM) low glucose. HEL 299 cells were cultured in Minimum Essential Medium (MEM). All medium contained 10% fetal bovine serum (FBS) and 1% penicillin-streptomycin. In addition, cells were maintained at 37℃ under 5% CO2 atmosphere.
MTT assay – To measure the cell viability, we used an MTT assay. A549 and HEL 299 cells were treated with TAR (0, 1, 2.5, 5 μM) for 24 h. After that, MTT solution (2 mg/mL) 30 μL was added into each well for 2 h and MTT lysis buffer 100 μL was added for overnight to lyse the MTT formazans. The absorbance was measured by varioskan lux (Thermo Fisher Scientific Inc, Waltham, MA) at 570 nm. Cell viability was normalized as relative percentage in comparison with non-treated controls.
Western blot analysis – For detection of various proteins, TAR treated whole-cell extracts were lysed in a lysis buffer [(20 mM Tris (pH 7.4), 250 mM NaCl, 2 mM EDTA (pH 8.0), 0.1% Triton X-100, 0.01 mg/mL aprotinin, 0.005 mg/mL leupeptin, 0.4 mM phenyl methane sulfonyl fluoride (PMSF), and 4 mM NaVO4)]. Then protein concentration in the whole cell lysates was measured by Bradford reagent (Bio-Rad, Hercules, CA). Equal amounts of lysates were resolved in an 8–15% SDS-polyacrylamide gel. After electrophoresis, the protein was transferred to nitrocellulose membrane, that was blocked with 5% skim milk in 1X Tris-buffered saline with 0.1% Tween 20 and probed with various specific primary antibodies: anti-phospho-STAT3 (Tyr705), anti-phospho-STAT3 (Ser727), anti-phospho-JAK1 (Tyr1022/1023), anti-JAK1, anti-phospho-JAK2 (Tyr1007/1008), anti-JAK2, anti-phospho-Src (Tyr416), anti-Src, anti-Procaspase-3, anti-Cleaved caspase3, anti-Cyclin D1, anti-STAT3, anti-PARP, anti-Survivin, anti-IAP-1, anti-COX-2, anti-MMP9, and anti-β-actin antibodies. Antibodies were incubated at 4℃ for overnight. Finally, membranes were washed with 1 × TBST and incubated with horseradish peroxidase (HRP) conjugated anti-rabbit IgG antibodies, and anti-mouse IgG antibodies at room temperature for 1 h. The membranes were detected using a chemiluminescence (ECL) (EZ-Western Lumi Femto, DOGEN).
Immunocytochemistry – A549 cells were treated with TAR 5 μg/mL for 8 h. Subsequently, the cells were fixed using 4% paraformaldehyde (PFA) at room temperature for 20 min, followed by a wash with 1X PBS, and permeabilization with 0.2% Triton X-100. Blocking was performed with 5% BSA for 1 h, after which the cells were incubated overnight at 4oC with anti-phospho-STAT3 (Tyr705) and anti-STAT3 antibodies at a dilution of 1:100. The following day, the cells were washed thrice with 1X PBS and incubated with Alexa Fluor® 488 donkey anti-mouse IgG (H+L) and Alexa Fluor® 594 donkey anti-rabbit IgG (H+L) antibodies at room temperature for 1 h. Cells were then stained with DAPI (1 μg/mL) for three minutes at room temperature. The slides were mounted using Fluorescent Mounting Medium (Golden Bridge International Labs, Mukilteo, WA). Fluorescence signals were observed using an Olympus FluoView FV1000 confocal microscope (Tokyo, Japan).
EMSA for STAT3-DNA binding – STAT3-DNA binding was analyzed by electrophoretic mobility shift assay (EMSA). Cells were treated under specified conditions for varying time periods and concentrations, followed by the preparation of nuclear extracts using 10× binding buffer, poly(di-dc), NP-40, and a specific probe. A 5’-biotinylated STAT3 oligonucleotide pair (5’-GATCCTTCTGGGAATTCCTAGATC-3’ and 5’-GATCTAGGAATTCCCAGAAGGATC-3’; BIONEER, Daejeon, Korea) was used in conjunction with nuclear proteins. For a loading control, Oct-1 oligonucleotides (5’-TTCTAGTGATTTGCATTCGACA-3’ and 5’-TGTCGAATGCAAATCACTAGAA-3’; BIONEER, Daejeon, Korea) were utilized. The protein-DNA complexes were loaded onto a polyacrylamide gel, transferred to a nylon membrane, and cross-linked using 540 nm UV light. The proteins were then detected using the LightShift® Chemiluminescent EMSA kit (Waltham, MA).
Live and dead assay – A549 cells were treated with 2 μg/mL TAR and 3 μM cisplatin for 24 h. For staining, cells were treated with 5 μM Calcein AM and 5 μM Ethidium homodimer-1 (Invitrogen) at 37oC for 30 min. Live cells, due to their active intracellular esterases, convert Calcein AM into a brightly fluorescent calcein that emits a green fluorescence. Conversely, dead cells, characterized by compromised cellular membranes, allow Ethidium homodimer-1 to permeate and bind to nucleic acids, resulting in a bright red fluorescence. The stained cells were then visualized using an Olympus FluoView FV1000 confocal microscope (Tokyo, Japan).
Real-time cell proliferation analysis – Cell growth behavior was analyzed using the Roche xCELLigence Real-Time Cell Analyzer (RTCA) DP instrument (Roche Diagnostics GmbH, Germany). Background impedance was measured in cell culture medium per well. Then, A549 cells (5 × 10³ cells/well) were seeded onto 16-well E-plates. Impedance was recorded in 15 min intervals. Cell index values were normalized to the time point of TAR administration.
Invasion assay – Real-time monitoring of cellular invasion was conducted using the RTCA DP instrument (Roche Diagnostics GmbH, Germany), employing a CIM (cellular invasion/migration)-plate 16 for electrical impedance measurements. The upper chamber of the CIM-plates was coated with Matrigel (BD Biosciences, Becton-Dickinson, Franklin Lakes, NJ), and the lower chamber was filled with medium containing 10% FBS to serve as a chemoattractant. Both chambers were then assembled. Serum-free medium was added to the upper chamber, and the system was incubated at 37oC for 1 hour to measure background impedance. After background measurement, A549 cells (1 × 10⁵ cells/well) were seeded in the upper chamber and the electrical impedance of the membrane was recorded every 15 minutes. start record the electrical impedance of the membrane every 15 min.
Wound healing assay – Wound healing assay was performed in monolayer of cells. The cells (2 × 10⁵ cells/well) were plated in 12-well plate and incubated until 80% confluence reached. Then cell monolayer was scratched by 200 μL micropipette tip and washed with serum-free medium. After that, cells were treated with TAR and incubated with serum-free medium for 24 h. Width of wound was observed by using a microscope (Nikon ECLIPSE Ts2) at the initial time 0 h and again at 24 h. The gap distance of the wound was measured at four distinct points, and samples without treatment served as controls.
Qualitative analysis of TAR by UPLC-QTOF MS – Chromatographic analysis of the extract was performed to identify and provide chemical compositions because there was no information about chemical components. Approximately 10 mg of the extract was shaken with 1 mL of 70% ethanol by a vortex mixer for 30 seconds. The supernatants were filtered through a 0.2 μm polytetrafluoroethylene syringe filter (Thermo Scientific). Finally, the filtrate was transferred to a LC sample vial before use. The liquid chromatography-high resolution mass spectrometry system consisted of a Thermo Scientific Vanquish UPLC system (Thermo Fisher Scientific, Sunnyvale, CA, USA) with a Shim-pack GIS-ODS (3.0 mm × 100 mm, 3 μm; Shimadzu) and a Triple TOF5600+ mass spectrometer system (Triple TOF MS; QTOF, SCIEX, Foster City, CA, USA). The QTOF MS, equipped with a DuosprayTM ion source, and was used to complete the high-resolution experiment. The LC gradient used a mobile phase A containing 0.1% formic acid in water and a mobile phase B containing 0.1% formic acid in acetonitrile. The flow rate was kept constant at 0.8mL/min and the injection volume was 2 μL.The gradient elution system began at 5% B for 0.8 min, 5–20% B from 0.8 to 2.5 min, 20–32% B from 2.5 to 8.5 min, 32–70% from 8.5 to 11.5min, then increased to 100% B at 12.0 min, held at 100% B for 3 min and then returned to the initial conditions for re-equilibration. Mass data acquisition was performed with a Triple TOF 5600+ in negative ion mode using the following parameters: source temperature was set at 450oC with a curtain gas flow of 25 L/min (GS1 and GS2 both 50), the ion spray voltage was set at −4500 V, declustering potential was 30 V, and the collision energy was 10 V. High-purity nitrogen gas was used for the nebulizer/DuosprayTM and curtain gases. The QTOF and information-dependent acquisition (IDA) scan was operated with a mass range of 80–1200 m/z. Precursor and product ion calibration were performed in both high sensitivity and high-resolution modes using a calibrant delivery system prior to analysis. Data acquisition and processing for qualitative analysis were carried out using Analyst TF 1.7, PeakVeiw2.2 and MasterView (SCIEX, Foster City, CA, USA).
Statistical analysis – The results have been expressed as mean ± SD, and an analysis of variance (ANOVA) with Bonferroni’s test was used for the statistical analysis and multiple comparisons of the data. p-value of 0.05 or less was considered as significant.
Results and Discussion
The goal of this study was to determine whether TAR exerts its anti-proliferative and pro-apoptotic effects through the abrogation of the STAT3 signaling pathway in A549 cells. We found that TAR inhibited constitutive STAT3 activation in human lung cancer cells with the suppression of JAK1, JAK2, and c-Src activation. TAR down-regulated the expression of various STAT3-regulated gene products, including Survivin, IAP-1, Cyclin D1, COX-2, and MMP-9. It also caused the inhibition of cell proliferation and induced the apoptosis. Moreover, TAR enhanced the apoptotic effects of cisplatin in A549 cells.
First, we investigated the cell viability by MTT assay (Fig. 1A). A549 and HEL 299 cells were treated with TAR (0, 1, 2.5, and 5 μg/mL) for 24 h. TAR suppressed cell viability in concentration dependent manner. A549 cells had lower cell viability than HEL 299 cells. Additionally, we measured cell proliferation with Roche xCELLigence Real-Time Cell Analyzer (RTCA) DP instrument (Roche Diagnostics GmbH, Germany). A549 cells were seeded in 16 well E-plate with (1 and 5 μg/mL) of TAR and measured cell proliferation (Fig. 1D). TAR significantly reduced cell proliferation in A549 cells.

TAR promotes apoptosis and inhibits cell proliferation, migration, and invasion. (A) A549 and H1299 cells were treated with the indicated concentrations of TAR for 24 h. Cell viability was determined by MTT assay. (B-C) A549 cells (1 × 10⁵ cells/well) were treated with TAR (0, 1, 2.5, 5 μg/mL) for 24 h. Whole-cell extracts were prepared and Western blot analysis for Procaspase-3, Cleaved caspase-3, PARP, Survivin, IAP-1, Cyclin D1, COX-2, MMP-9, and β-actin. β-actin was used as an international control. (D) A549 cells (5 × 10³ cells/well) were treated with TAR (0, 1, 5 μg/mL) and measured cell proliferation by using the Roche xCELLigence Real-Time Cell Analyzer (RTCA) DP instrument (Roche Diagnostics GmbH, Germany). (E) A549 cells (1 × 10⁵ cells/well) were seeded in CIM-plate 16 pre-coated with matrigel and treated with TAR 1 μg/mL. Invasion assay was performed using the Roche xCELLigence Real-Time Cell Analyzer (RTCA) DP instrument (Roche Diagnostics GmbH, Germany). (F) To determined migration, Width of wound was measured at time 0 and 24 h of incubation with and without TAR. The results shown are representative data of experiments.
We examined the role of TAR in suppressing both cell invasion and migration. Invasion was examined by RTCA. As shown Fig. 1E, TAR reduced tumor cell invasion activity. Next, wound healing assay was examined for analyzing the cell migration (Fig. 1F). A549 cells were scratched and treated with indicated concentrations of TAR for 24 h. Then, gap difference was measured at 0 h and 24 h after TAR treatment. Thus, TAR inhibited both invasion and migration in lung cancer cells.
As shown Fig. 1B, TAR induced apoptosis through the cleavage of caspase-3 and PARP. Also, western blot analysis showed that TAR treatment reduced expressions of various proteins such as Survivin, IAP-1, Cyclin D1, COX-2, and MMP-9 (Fig. 1C). We found that TAR induced apoptosis and suppressed the expression of various oncogenic proteins.
Recent reports indicate that inhibition of constitutive STAT3 activation has emerged as an attractive strategy for the treatment of lung cancer.11,17–19 We investigated whether TAR can regulate constitutive STAT3 phosphorylation in A549 lung cancer cells. As shown Fig. 2A, TAR down-regulated phospho-STAT3(Tyr705) and phospho-STAT3(Ser727) expression in time dependent manner.

TAR can downregulate constitutive STAT3 activation in A549 cells. (A) A549 cells were treated with TAR 5 μg/mL for various intervals (0, 1, 2, 4, 6, 8, 12 h). Lysates from the cells were analyzed for phosphor-STAT3(Tyr705), phosphor-STAT3(Ser727), STAT3, and β-actin. (B) A549 cells were treated with various concentration and time intervals and nuclear STAT3 levels were measured by EMSA. (C) A549 cells were treated with TAR 5 μg/mL for 8 h and intracellular STAT3 distribution was analyzed by immunocytochemistry. (D) A549 cells were treated with TAR 5 μg/mL for (0, 2, 4, 8 h). Whole-cell extracts were prepared and Western blot analysis for phospho-JAK(Tyr1022/1023), JAK1, phospho-JAK2(Tyr1007/1008), JAK2, phospho-Src(Tyr416), Src, and β-actin. The results shown are representative data of experiments.
Since STAT3 dimerization leads to the transcription of target genes through its translocation into the nucleus, we investigated whether TAR could inhibit STAT3’s ability to bind DNA using EMSA. As depicted in Fig. 2B, TAR reduced STAT3-DNA binding activity in a time- and concentration-dependent manner, with Oct-1 serving as a loading control. Furthermore, we assessed the nuclear translocation of STAT3 in A549 cells through immunocytochemistry (Fig. 2C). TAR effectively prevented the movement of STAT3 from the cytoplasm to the nucleus in A549 cells.
Because STAT3 can be activated through Src and JAK families, we determined whether TAR can inhibit the phosphorylation of JAK1, JAK2 and Src in A549 cells. The cells were treated with 5 μg/mL of TAR for indicated times and western blot analysis was performed. We found that TAR substantially suppressed JAK1, JAK2, and Src activation.
Next, we focused on the combination treatment of TAR and cisplatin. Cisplatin is first-line chemotherapy for the treatment of NSCLC, but this drug has severe side effects and patients frequently develop chemoresistance.20,21 Additionally, cisplatin has shown synergistic interaction with various classes of targeted therapeutic agents.21–23 Initially, we evaluated the synergistic cytotoxic effects of TAR (2 μg/mL) and cisplatin (3 μM) using an MTT assay. A549 cells were exposed to different concentrations of TAR (0, 1, 2 μg/mL) and cisplatin (0, 1, 3, 5 μM) for 24 hours. Using Calcusyn software (BIOSOFT, Ferguson, MO), the optimal combination was determined to be 2 μg/mL TAR with 3 μM cisplatin (Fig. 3A). Subsequently, we assessed the synergistic effects on apoptosis. The Live and Dead assay, depicted in Fig. 3B, revealed that cells treated with a combination of TAR and cisplatin exhibited greater induction of apoptosis compared to those treated with each agent alone. Additionally, Western blot results indicated increased cleavage of caspase-3 and PARP in combination-treated cells, as illustrated in Fig. 3C. Moreover, there was a more pronounced reduction in the expression of anti-apoptotic proteins in cells treated with both TAR and cisplatin, as shown in Fig. 3D.

TAR and cisplatin can induce apoptosis in a synergic manner. (A) To measure the cytotoxicity of TAR and cisplatin, we used the MTT assay. A549 cells were treated with TAR and cisplatin in various concentrations for 24 h. The average of CI values about various combination show that the best combination ratio is 2 μg/mL TAR and 3 μM cisplatin. Data represent means ± SD. **p < 0.01 vs non-treated (NT) cells. ***p < 0.001 vs NT cells. (B) Live and Dead assay was performed to confirm the synergic effects on A549 cells with 2 μg/mL TAR and 3 μM cisplatin. Live cells were stained in green and dead cells were stained in red. The graph shows the rate of dead cells by quantification. Data represent means ± SD. **p < 0.01, ***p <0.001. (C-D) A549 cells were treated with 2 μg/mL TAR and 3 μM cisplatin for 24 h. Equal amounts of whole cell lysates were prepared and expression of various antibodies were analyzed by Western blot analysis. The results shown are representative data of experiments.
The combination of TAR and cisplatin significantly reduced constitutive STAT3 activation and the activity of its upstream kinases. We investigated the synergistic effects of the optimal concentrations on constitutive STAT3 activation and its upstream signaling kinases. A549 cells (1 × 10⁶ cells/well) were treated with 2 μg/mL TAR with 3 μM cisplatin for 8 h then analyzed by Western blotting. As shown Fig. 4A and B, combination treatment had synergistic suppression effects on phospho-STAT3 (Tyr705), phospho-STAT3 (Ser727), phospho-JAK1(Tyr1022/1023), phospho-JAK2 (Tyr1002/1008), and phospho-Src (Tyr416) activation.

TAR enhances cisplatin in A549 cells and base peak chromatograms (BPC) of the TAR ext. (A and B) A549 cells were treated with 2 μg/mL TAR and 3 μM cisplatin for 8 h. Lysates from the cells were analyzed by Western blot analysis using various antibodies as indicated above. (C) Base peak chromatogram (BPC) of the TAR ext. (D) Extracted ion chromatograms (XIC) of six authentic standards analyzed by UHPLC-QTOF MS in negative ion mode. (E) A schematic diagram showing the effects of TAR on STAT3 signaling pathways and apoptosis in A549 cells.
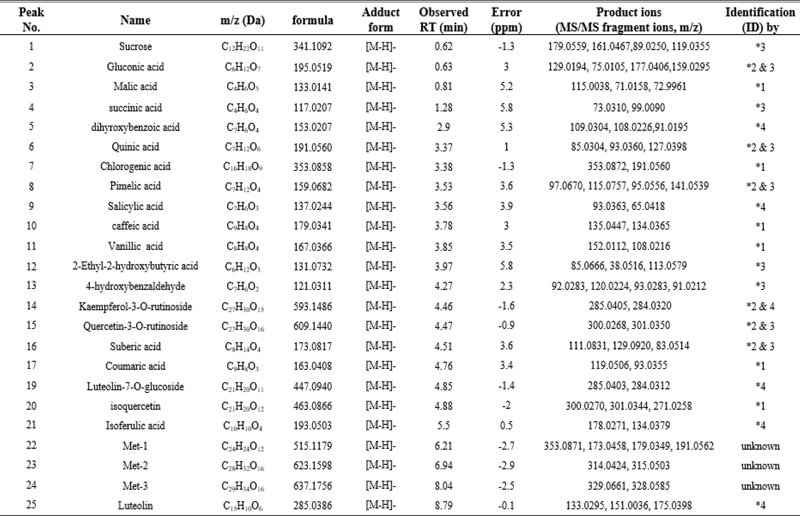
UHPLC-QTOF MS analysis was employed to characterize the chemical profile and identify the chemical components in TAR. This study marks the first documentation of the chemical constituents in S. triqueter. The chromatograms displayed a variety of peaks, reflecting the diverse chemical constituents present in the TAR extract, as depicted in Fig. 4C and E. The chromatographic and MS data, including information on flavonoids, cinnamic acid derivatives, and glycosides associated with specific peaks, are detailed in Table 1. Initial identification of each compound in the extract involved comparison with authentic standards using the MasterView software in PeakView. Components such as malic acid, chlorogenic acid, caffeic acid, vanillic acid, coumaric acid, and isoquercetin were confirmed with authentic standards. For further identification, the UHPLC-QTOF MS base peak chromatogram in information-dependent acquisition scan mode was used to screen and search for components based on exact masses and fragmentation ions. This was done using both an in-house MS/MS library and online databases like Metlin and MassBank. A total of nineteen compounds were tentatively identified by matching them with reference standards or MS/MS spectra from the in-house library and databases, as listed in Table 1. According to previous studies, some of the key compounds identified possess anti-tumor properties.24–30 For example, luteolin exerts anti-tumor activities through modulating PI3K/Akt, STAT3 signaling pathways and stimulating apoptosis.24–26 Additionally, chlorogenic acid is known for its significant pharmacological benefits, including antioxidant, anti-diabetic, and anti-tumor activities.27,28

The chemical profile and identification of chemical components authentically or tentatively in S. triqueter using UPLC-QTOF MS/MS analysis
In conclusion, this study demonstrated that TAR can exert significant anti-proliferative and pro-apoptotic effects in A549 lung cancer cells through the inhibition of the STAT3 signaling pathway. By suppressing the activation of JAK1, JAK2, and Src, TAR effectively down-regulated the expression of STAT3-regulated genes involved in cell survival and proliferation, such as Survivin, IAP-1, Cyclin D1, COX-2, and MMP-9. Additionally, TAR reduced cell invasion and migration, further emphasizing its potential as a therapeutic agent. Notably, the combination of TAR and cisplatin exhibited synergistic effects, enhancing apoptosis and reducing the expression of anti-apoptotic proteins more effectively than either agent alone. This combination also synergistically inhibited both constitutive STAT3 activation and its upstream kinases, thereby presenting a viable approach to counteract chemoresistance in NSCLC. Finally, the LC-HRMS analysis of TAR provided a comprehensive chemical profile, identifying several key compounds that may contribute to its biological activities. These findings support the potential of TAR as a valuable addition to current cancer therapies, warranting further investigation and development.
Acknowledgments
This work was supported by a National Research Foundation of Korea (NRF) grant funded by the Korean government (MSIP) (NRF-2021R1I1A2060024 and NRF-2021R1F1A1049427).
Conflicts of Interest
The authors declare that they have no conflicts of interest.
References
-
Gu, S.; Zhang, R.; Gu, J.; Li, Z.; Lv, L.; Jiang, J.; Xu, Z.; Wang, S.; Shi, C.; Wang, D. P.; Wu, C. Oncol. Rep. 2017, 37, 474–482.
[https://doi.org/10.3892/or.2016.5268]

-
Wang, J.; Wei, H.; Zhao, B.; Li, M.; Lv, W.; Lv, L.; Song, B.; Lv, S. J. Mol. Histol. 2014, 45, 641–652.
[https://doi.org/10.1007/s10735-014-9583-2]
-
Osada, H.; Takahashi, T. Oncogene 2002, 21, 7421–7434.
[https://doi.org/10.1038/sj.onc.1205802]
-
Shen, F.; Gai, J.; Xing, J.; Guan, J.; Fu, L.; Li, Q. Biochem. Biophys. Res. Commun. 2018, 495, 1158–1166.
[https://doi.org/10.1016/j.bbrc.2017.11.109]
-
Baek, S. H.; Ko, J.-H.; Lee, H.; Jung, J.; Kong, M.; Lee, J.-W.; Lee, J.; Chinnathambi, A.; Zayed, M. E.; Alharbi, S. A.; Lee, S.-G.; Shim, B. S.; Sethi, G.; Kim, S.-H.; Yang, W. M.; Um, J.-Y.; Ahn, K. S. Phytomedicine 2016, 23, 566–577.
[https://doi.org/10.1016/j.phymed.2016.02.011]
-
Lee, J. H.; Kim, C.; Baek, S. H.; Ko, J.-H.; Lee, S. G.; Yang, W. M.; Um, J. Y.; Sethi, G.; Ahn, K. S. Oncotarget 2017, 8, 17700–17711.
[https://doi.org/10.18632/oncotarget.10775]
-
Lee, H. W.; Ko, J.-H.; Beak, S. H.; Nam, D.; Lee, S. G.; Lee, J; Yang, W. M.; Um, J.-Y.; Kim, S.-H.; Shim, B. S.; Ahn, K. S. Phytother. Res. 2016, 30, 1021–1032.
[https://doi.org/10.1002/ptr.5612]
-
Baek, S. H.; Lee, J. H.; Kim, C.; Ko, J.-H.; Ryu, S.-H.; Lee S.-G.; Yang, W. M.; Um, J.-Y.; Chinnathambi, A.; Alharbi, S. A.; Sethi, G.; Ahn, K. S. Molecules 2017, 22, 276.
[https://doi.org/10.3390/molecules22020276]
-
Kim, S.-M.; Kim, C.; Bae, H.; Lee, J. H.; Baek, S. H.; Nam, D.; Chung, W.-S.; Shim, B. S.; Lee, S.-G.; Kim, S.-H.; Sethi, G.;Ahn, K. S. Mol. Carcinog. 2015, 54, 1132–1146.
[https://doi.org/10.1002/mc.22184]
-
Chai, E. Z. P.; Shanmugam, M. K.; Arfuso, F.; Dharmarajan, A.; Wang, C.; Kumar, A. P.; Samy, R. P.; Lim, L. H. K.; Wang, L.; Goh, B. C.; Ahn, K. S.; Hui, K. M.; Sethi, G. Pharmacol. Ther. 2016, 162, 86–97.
[https://doi.org/10.1016/j.pharmthera.2015.10.004]
-
Lee, J. H.; Kim, C.; Sethi, G.;Ahn, K. S. Oncotarget 2015, 6, 6386–6405.
[https://doi.org/10.18632/oncotarget.3443]
-
Calo, V.; Migliavacca, M.; Bazan, V.; Macaluso, M.; Buscemi, M.; Gebbia, N.; Russo, A. J. Cell Physiol. 2003, 197, 157–168.
[https://doi.org/10.1002/jcp.10364]
-
Zhang, X.; Chen, L.; Liu, X.; Wang, C.; Chen, X.; Xu, G.; Deng, K. Environ. Sci. Pollut. Res. Int. 2014, 21, 8198–8205.
[https://doi.org/10.1007/s11356-014-2807-x]
-
Hu, X.; Liu, X.; Zhang, X.; Cao, L.; Chen, J.; Yu, H. Chemosphere 2017, 188, 397–402.
[https://doi.org/10.1016/j.chemosphere.2017.08.173]
-
Liu, X.; Wang, Z.; Zhang, X.; Wang, J.; Xu, G.; Cao, Z.; Zhong, C.; Su, P. Ecotoxicol. Environ. Saf. 2011, 74, 1967–1972.
[https://doi.org/10.1016/j.ecoenv.2011.06.005]
-
Li, H.-L.; Lei, G.-C.; Zhi, Y.-B.; An, S.-Q.; Huang, H.-P.; Ouyang, Y.; Zhao, L.; Deng, Z. F.; Liu, Y. H. PLoS One 2011, 6, e25629.
[https://doi.org/10.1371/journal.pone.0025629]
-
Iriki, T.; Ohnishi, K.; Fujiwara, Y.; Horlad, H.; Saito, Y.; Pan, C.; Ikeda, K.; Mori, TM. Suzuki, M.; Ichiyasu, H.; Kohrogi, H.; Takeya, M.; Komohara, Y. Lung Cancer 2017, 106, 22–32.
[https://doi.org/10.1016/j.lungcan.2017.01.003]
- Meng, L.-Q.; Liu, C.; Luo, Y.-H.; Piao, X.-J.; Wang, Y.; Zhang, Y.; Wang, J.-R.; Wang, H.; Xu, W.-T.; Liu, Y.; Wu, Y.-Q.; Sun, H.-N.; Han, Y.-H.; Jin, M.-H.; Shen, G.-N.; Zang, Y.-Q.; Li, J.; Fang, N.-Z.; Cui, Y.-D.; Jin, C. H. Mol. Med. Rep. 2018, 17, 2626–2634.
-
Jiang, S.; Gao, Y.; Hou, W.; Liu, R.; Qi, X.; Xu, X.; Li, J.; Bao, Y.; Zheng, H.; Hua, B. Oncol. Lett. 2016, 12, 1380–1386.
[https://doi.org/10.3892/ol.2016.4768]
-
Fennell, D. A.; Summers, Y.; Cadranel, J.; Benepal, T.; Christoph, D. C.; Lal, R.; Das, M.; Maxwell, F.; Visseren-Grul, C.; Ferry, D. Cancer Treat. Rev. 2016, 44, 42–50.
[https://doi.org/10.1016/j.ctrv.2016.01.003]
-
Dasari, S.; Tchounwou, P. B. Eur. J. Pharmacol. 2014, 740, 364–378.
[https://doi.org/10.1016/j.ejphar.2014.07.025]
-
Yoneda, S.; Honma, T.; Yoshida, S.; Min, K. Y.; Noguchi, Y.; Sakura, M. Oncology 1985, 42, 1–6.
[https://doi.org/10.1159/000225991]
- Zuo, Y.; Yang, D.; Yu, Y.; Xiang, M.; Li, H.; Yang, J.; Li, J.; Jiang, D.; Zhou, H.; Xu, Z.; Yu, Z. Mol. Med. Rep. 2018, 17, 3497–3502.
-
Lin, Y.; Shi, R.; Wang, X.; Shen, H.-M. Curr. Cancer Drug Targets, 2008, 8, 634–646.
[https://doi.org/10.2174/156800908786241050]
-
Horinaka, M.; Yoshida, T.; Shiraishi, T.; Nakata, S.; Wakada, M.; Nakanishi, R.; Nishino, H.; Matsui, H.; Sakai, T. Oncogene 2005, 24, 7180–7189.
[https://doi.org/10.1038/sj.onc.1208874]
-
Selvendiran, K.; Koga, H.; Ueno, T.; Yoshida, T.; Maeyama, M.; Torimura, T.; Yano, H.; Kojiro, M.; Sata, M. Cancer Res 2006, 66, 4826–4834.
[https://doi.org/10.1158/0008-5472.CAN-05-4062]
-
Gupta, A.; Atanasov, A. G.; Li, Y.; Kumar, N.; Bishayee, A. Pharmacol. Res. 2022, 186, 106505.
[https://doi.org/10.1016/j.phrs.2022.106505]
-
Miao, M.; Xiang, L. Adv. Pharmacol. 2020, 87, 71–88.
[https://doi.org/10.1016/bs.apha.2019.12.002]
-
Ranjbary, A. G.; Bagherzadeh, A.; Sabbaghi, S. S.; Faghihi, A.; Karimi, D. N.; Naji, S.; Kardani, M. Mol. Biol. Rep. 2023, 50, 9845–9857.
[https://doi.org/10.1007/s11033-023-08854-y]
-
Velli, S. K.; Sundaram, J.; Murugan, M.; Balaraman, G.; Thiruvengadam, D. J. Biochem. Mol. Toxicol. 2019, 33, e22382.
[https://doi.org/10.1002/jbt.22382]