Analysis of α-Glucosidase Inhibitory Constituents from Acer tegmentosum Using LC-QTOF MS/MS And Molecular Networking
Abstract
This study was conducted to investigate the difference in activity of each part of Acer tegmentosum, for which there are few studies on α-glucosidase inhibitory activity and the compounds contributing to the activity. Among the barks, twigs, and leaves extracts of A. tegumentum, α-glucosidase inhibitory activity of barks extracts was shown the highest inhibition. 6'-O-Galloyl salidroside (1), (-)-epicatechin-3-O-gallate (2), salidroside (3), procyanidin B2 (4) and procyanidin B2-3'-O-gallate (5) were isolated from barks using LC-QTOF MS/MS and molecular networking to identify compounds expected to contribute to high inhibition. The isolated compounds and two in-house compounds, catechin (6) and (+)-epigallocatechin (7) were evaluated for the α-glucosidase inhibitory activity. As a result, compounds 1, 2 and 5 showed high inhibitory activity, and all three compounds commonly contain a galloyl moiety. Additionally, Pearson’s correlation analysis showed that compounds 2 and 5 had a strong correlation with α-glucosidase inhibitory activity, and quantitative analysis on each part revealed that barks had the highest content of the three compounds. These results demonstrate that extracts and compounds with a galloyl moiety from barks of A. tegmentosum might be a potential discovery of new drugs for antidiabetic effects.
Keywords:
Acer tegmentosum, LC-QTOF MS/MS, galloyl moiety, molecular networking, α-glucosidase inhibitory activityIntroduction
Type 2 diabetes mellitus is a common metabolomics disorder in the current world which is mainly caused by β-cell from the pancreas as malfunctioning of insulin secretion and tissues from insulin are unable to react with insulin.1 The number of adults with diabetes has been estimated to increase by 51.4% from 2010 to 2030.2 The number of percentages represents serious attention is needed. α-glucosidase inhibitors are key for Type 2 diabetes by reducing the glucose absorption from the small intestine by inhibiting the release of disaccharides and ogliosaccharide.3,4 Until now, acarbose miglitol, and voglibose are widely used treatments for type 2 diabetes, but some side effects have been discovered such as diarrhea and nausea which indicates a deep study on developing treatment is required.5
Recent research has discovered the relationship between galloyl moiety and α-glucosidase inhibition as showed a potential α-glucosidase inhibitor once binding with amino acid residues from interaction with the active site of α-glucosidase.6,7 One study has found that a combination of acarbose and gallic acid provided a key importance in the management of type 2 diabetes and the result might possibly reduce the side effects of acarbose.8 Regarding current research, further experiments are required for a specific understanding of the relationship between galloyl moiety and α-glucosidase.
Acer tegmentosum (Aceraceae) is a traditional medicinal plant that has been distributed mostly in Korea, Russia and Northern China.9 In Korea, A. tegmentosum has historically been employed in traditional medicine for addressing liver ailments like hepatitis, liver cancer, and cirrhosis of the liver. Phenolic glycosides, flavonoids, quinones and coumarins have been reported as major compounds from A. tegmentosum.10 Many biological effects have been revealed from A. tegmentosum including antioxidation, anti-inflammatory, hepatoprotective, antiangiogneic activities and anti-adipogenic effects.11,12 Antidiabetic effect from the extract of A. tegmentosum has been reported previously.13 However, it is not yet known which specific compounds that affect activity.
Molecular networking is a recent innovative method for approaching the identification of known compounds in complex matrices and Global Natural Product Social Molecular Networking (GNPS) a web-based platform provides the molecular networking system.14 The concept of molecular networking is that based on metabolites MS/MS spectral similarity, a chemical similarity network is provided and displayed as chemical clusters.15 Molecular networking has been a key method for the identification of minor compounds that might not be able to visualize in LC-MS chromatograms.
In this study, the α-glucosidase inhibition assay was conducted on three different parts (barks, twigs, and leaves) from A. tegmentosum. Among these parts, the one with the highest activity was selected and isolated. By using LC-QTOF MS/MS and molecular networking, the target compounds containing galloyl moieties were analyzed and isolated. Quantitative analysis was performed to examine how the content of each part affects α-glucosidase inhibition. Additionally, statistical analysis was carried out to determine which compound had the greatest effect on the activity.
Experimental
General experimental procedures – LC-QTOF MS/MS - HPLC : Agilent 1260 Series equipped with a binary pump, degasser, an auto plate-sampler and a thermostatically controlled column compartment (Agilent Technologies, Inc., Santa Clara, USA), Mass spectrometry : Agilent 6530 Q-TOF mass spectrometer (Agilent Technologies, Inc., Santa Clara, USA), Column : Shiseido CAPCELL PAK MG C18 column (5 µm, 4.6 mm × 150mm, Osaka Soda, Osaka, Japan), Phenomenex C18 guard column (4.00× 3.00mm, Phenomenex, Torrance, USA), UV lamp detector (254, 365 nm) : VL-4 LC (Vilber, Marne-la-Vallée cedex, France), Silica gel 60 (230 – 400 mesh, 0.040 – 0.063 mm, Merck, Darmstadt, Germany), Sephadex LH-20 (GE Healthcare Bio-sciences AB, Uppsala, Sweden), Diaion HP-20 (250 – 850 µm, ~1.30 mL/g pore volume, Mitsubishi Chemical Corp., Tokyo, Japan), Silica gel 60 F254 plate (0.254 mm, Merck, Darmstadt, Germany), RP-18 plate (Merck, Darmstadt, Germany), 1D (1H-NMR, 13C-NMR) and 2D (HSQC, HMBC) NMR spectrums were recorded on a Bruker SPECTROSPIN operating at 600 MHz (1H) and 150 MHz (13C) with chemical shifts given in ppm (δ).
Plant materials – Barks and twigs of A. tegmentosum were obtained from Won Ho Farm market (Seoul, Korea) and leaves were obtained from Herb village market (Seoul, Korea). Samples (KUP-HD119, 120, and 122) were stored in the Laboratory of Pharmacognosy, College of Pharmacy, Korea university, Sejong, Republic of Korea.
Extraction and isolation – Barks of A. tegmentosum (3 kg) were extracted using sonication method with 80% MeOH for three times (90minutes each) at room temperature. Twigs and leaves of A. tegmentosum (250g) were extracted using sonication method with 80% MeOH for three times (90minutes each) at room temperature. The crude extract of barks (584.11 g) was obtained from the extract by evaporating using rotary evaporator. Suspension was made from crude extract with water and fractionated into four fractions, n-hexane, EtOAc, n-BuOH and water. EtOAc fraction was separated by column chromatography using silica gel with a gradient from n-hexane : EtOAc, 50 : 1, v/v to CHCl3 : MeOH: H2O, 2 : 1 : 0.01 v/v/v to obtain nine subfractions (E-1 to E-9). E-7 fraction was chromatographed using silica gel with a gradient from CHCl3 : MeOH, 10: 1, v/v to CHCl3 : MeOH : H2O, 3 : 1 : 0.1 (v/v/v) to obtain nine subfractions (E-7-1 to E-7-9). E-7-7 fraction was subjected to RP-C18 column chromatography in an isocratic condition of CH3COCH3 : H2O, 1 : 3 (v/v) to obtain four subfractions (E-7-7-1 to E-7-7-4) and compounds 1 and 2 were obtained from E-7-7-3 and E-7-7-4 respectively. E-7-7-2 was chromatographed using silica gel with an isocratic condition CHCl3 : MeOH, 8:1 to obtain two subfractions (E-7-7-2-1 to E-7-7-2-2) and compound 3 was obtained from E-7-7-2-2. E-10 fraction was chromatographed using HP-20 resin with a gradient from H2O : MeOH, 100 : 0 to 0 : 100 (v/v) to obtain six subfractions (E-10-1 to E-10-6). E-10-4 was chromatographed using silica gel with a gradient from CHCl3 : MeOH, 10: 1 (v/v) to CHCl3 : MeOH : H2O, 2 : 1 : 0.2 (v/v/v) to obtain twelve subfractions (E-10-4-1 to E-10-4-12). E-10-4-8 fraction was subjected to RP-C18 column chromatography with a gradient from CH3COCH3 : H2O, 1 : 3 to 1 : 1 to obtain two subfractions (E-10-4-8-1 to E-10-4-8-2). E-10-4-8-1 fraction was chromatographed using Sephadex LH-20 resin with isocratic condition MeOH : H2O, 5 : 1 to obtain ten subfractions (E-10-4-8-1-1 to E-10-4-8-1-10). E-10-4-8-1-5 was purified using semi-preparative HPLC with isocratic condition H2O : ACN, 85 : 15 and compound 4 was obtained. E-10-4-8-1-10 was purified using semi-preparative HPLC with isocratic condition H2O : ACN, 85 : 15 and compound 5 was obtained.
6'-O-Galloyl salidroside (1) - Light brown powder, HR-ESI-MS m/z: 451.1283 [M-H]-; 1H-NMR (600 MHz, CD3OD): δH 7.10 (2H, s, H-2'', 6''), 6.98 (2H, d, J = 8.47 Hz, H-2, 6), 6.65 (2H, d, J = 8.47 Hz, H-3, 5), 4.52 (1H, dd, J = 11.84, 2.20 Hz, H-6'-a), 4.44 (1H, dd, J = 11.89, 5.75 Hz, H-6'-b), 4.33 (1H, d, J = 7.82 Hz, H-1'), 3.93 (1H, ddd, J = 9.91, 8.46, 6.95 Hz, H-8a), 3.70 (1H, ddd, J = 9.88, 8.44, 6.67 Hz, H-8b), 3.56 (1H, ddd, J = 9.37, 5.82, 2.13 Hz, H-5'), 3.40 (2H, dd, J = 9.15, 7.85 Hz, H-3', 4'), 3.22(1H, dd, J = 9.03, 7.83 Hz, H-2'), 2.80 (2H, dt, J = 8.23, 6.59 Hz, H-7); 13C-NMR (150 MHz, CD3OD): δC 167.0 (-COO-), 155.3 (C-4), 145.1 (C-3'', 5''), 138.5 (C-4''), 129.5 (C-2,6), 129.2 (C-1), 120.0 (C-1''), 114.7 (C-3), 114.7 (C-5), 108.8 (C-2'',6''), 103.1 (C-1'), 76.6 (C-3'), 74.1 (C-5'), 73.7 (C-2'), 70.9 (C-8), 70.4 (C-4'), 63.5 (C-6'), 35.1 (C-7).
(-)-Epicatechin-3-O-gallate (2) - Dark brown powder, : -40.5 (c 0.25, MeOH); HR-ESI-MS m/z: 441.0833 [M-H]-; 1H-NMR (600 MHz, CD3OD): δH 6.95 (2H, s, H-2'', 6''), 6.93 (1H, d, J = 2.10, H-2'), 6.81 (1H, dd, J = 8.24, 2.08, H-6'), 6.69 (1H, d, J = 8.16, H-5'), 5.96 (1H, d, J = 3.53, H-8), 5.96 (1H, d, J = 3.48, H-6), 5.53 (1H, ddd, J = 4.40, 2.58, 1.35, H-3), 5.03 (1H, s, H-1), 2.99 (1H, dd, J = 17.70, 4.66, H-4a), 2.85 (1H, dd, J = 17.70, 2.56, H-4b) ppm; 13C-NMR (150 MHz, CD3OD): δC 167.6 (-COO-), 157.9 (C-5), 157.8 (C-7), 157.3 (C-8a), 146.3 (C-3'', 5''), 146.0 (C-3'), 145.9 (C-4'), 139.8 (C-4''), 131.4 (C-1'), 121.5 (C-1''), 119.4 (C-6'), 116.0 (C-5'), 115.1 (C-2'), 110.2 (C-2'', 6''), 99.4 (C-4a), 96.5 (C-6), 95.9 (C-8), 78.6 (C-2), 70.0 (C-3), 26.9 (C-4).
Salidroside (3) - White powder, HR-ESI-MS m/z: 299.1180 [M-H]-; 1H-NMR (600 MHz, CD3OD): δH 7.09 (2H, d, J = 8.43 Hz, H-2, 6), 6.72 (2H, d, J = 8.46 Hz, H-3, 5), 4.31 (1H, d, J = 7.80 Hz, H-1'), 4.06 (1H, ddd, J = 9.68, 8.32, 6.71 Hz, H-7), 3.89 (1H, dd, J = 11.92, 2.10 Hz, H-6'a), 3.71 (2H, m, H-6'b, 8b), 3.32 (3H, m, H-3', 4', 5'), 3.21 (1H, dd, J = 9.18, 7.78 Hz, H-2'); 13C-NMR (150 MHz, CD3OD): δC 155.4 (C-1), 129.5 (C-3, 5), 129.4 (C-4), 114.7 (C-2, 6), 103.0 (C-1'), 76.7 (C-4'), 76.5 (C-3'), 73.7 (C-2'), 70.7 (C-5'), 70.2 (C-8), 61.4 (C-6'), 35.0 (C-7).
Procyanidin B2 (4) - Light yellow powder, HR-ESI-MS m/z: 577.1381 [M-H]-; 1H-NMR (600 MHz, DMSO-d6): Upper unit: δH 6.79 (1H, s, H-2'), 6.52 (2H, d, J = 6.56 Hz, H-5',6'), 5.80 (1H, s, H-6), 5.70 (1H, s, H-8), 5.01 (1H, s, H-2), 4.40 (1H, s, H-4), 3.61 (1H, d, J = 4.58 Hz, H-3). Lower unit: δH 6.75 (1H, s, H-2'), 6.65 (1H, d, J = 7.97 Hz, H-6'), 6.63 (1H, d, J = 8.17 Hz, H-5'), 5.78 (1H, s, H-6), 4.79 (1H, s, H-2), 3.91 (1H, s, H-3), 2.42 (1H, s, H-4); 13C-NMR (150 MHz, DMSO-d6): Upper unit: δC 156.6 (C-8a), 155.8 (C-5, 7), 144.4 (C-4'), 144.2 (C-3'), 131.4 (C-1'), 117.7 (C-6'), 115.2 (C-5'), 114.9 (C-2'), 102.1 (C-4a), 94.6 (C-6), 93.7 (C-8), 75.5 (C-2), 71.2 (C-3), 35.3 (C-4). Lower unit: δC 154.5 (C-7), 153.7 (C-5), 152.5 (C-8a), 144.6 (C-4'), 144.2 (C-3'), 131.1 (C-1'), 117.7 (C-6'), 115.2 (C-5'), 113.7 (C-2'), 107.1 (C-8), 98.6 (C-4a), 94.6 (C-6), 80.1 (C-2), 66.0 (C-3), 26.1 (C-4).
Procyanidin B2-3'-O-gallate (5) - Light pink powder, HR-ESI-MS m/z: 729.1469 [M-H]-; 1H-NMR (600 MHz, DMSO-d6): Upper unit: δH 6.90 (1H, s, H-2'), 6.62 (2H, d, J = 8.20 Hz, H-5',6'), 5.81 (1H, s, H-6), 5.73 (1H, s, H-8), 4.99 (1H, s, H-2), 4.51 (1H, s, H-4), 3.65 (1H, s, H-3). Lower unit: δ 6.79 (1H, s, H-2'), 6.53 (1H, d, J = 7.82 Hz, H-5'), 6.53 (1H, d, J = 7.19 Hz, H-6'), 5.83 (1H, s, H-6), 5.44 (1H, s, H-3), 5.14 (1H, s, H-2), 2.99 (1H, s, H-4), 2.65 (1H, s, H-4). Galloyl moiety: δH 6.85 (2H, s, H-2'', 6''); 13C-NMR (150 MHz, DMSO-d6): Upper unit: δC 156.5 (C-8a), 153.8 (C-5, 7), 145.4 (C-4'), 144.6 (C-3'), 131.2 (C-1'), 117.7 (C-6'), 115.2 (C-5'), 113.9 (C-2'), 102.0 (C-4a), 94.7 (C-6), 93.8 (C-8), 75.5 (C-2), 71.6 (C-3), 35.5 (C-4). Lower unit: δC 154.7 (C-8a), 153.8 (C-5,7), 145.4 (C-4'), 144.6 (C-3'), 129.2 (C-1'), 117.7 (C-6'), 115.2 (C-5'), 114.9 (C-2'), 108.8 (C-8), 97.6 (C-4a), 96.3 (C-6), 75.9 (C-2), 67.9 (C-3), 25.2 (C-4). Galloyl moiety: δC 165.67(-COO-), 144.3 (C-3'', 4'', 5''), 138.6 (C-1''), 108.8 (C-2'', 6'').
LC-QTOF mass spectrometry - For the mobile phase, 0.1% formic acid in water (solvent A) and 0.1% formic acid in acetonitrile (solvent B) were used with gradient conditions from 0 - 5 min 10% B, 5 - 30 min 10~90% B. The flow rate was set for 0.6 mL/min. The concentration and injection volume of the sample were set as 1 mg/mL and 5 μL respectively. For mass spectrometry, Agilent 6530 Q-TOF mass spectrometer (Agilent, Santa Clara, CA, USA) was used with ESI interface installed. Negative ionization mode was operated under capillary voltage 4000 V, fragmentor 175 V, skimmer 65 V, OCT 1RF Vpp 750 V, nebulizer pressure 40psi, drying gas temperature 325oC, sheath gas temperature 350oC conditions. Data were obtained in centroid mode and the mass range was selected as m/z 50 - 1700. For every experiment, the mass capability from the TOF analyzer was checked less than 5 ppm for reliability. Parameters for analysis of data were controlled in Mass Hunter Workstation software, LC-MS/MS Data Acquisition for 6530 series Q-TOF (version B.05.00).
α-Glucosidase inhibition assay - For measuring α-glucosidase inhibitory activity, α-glucosidase enzyme was prepared in 0.16 U/mL in 0.1 mM PBS with 0.2% BSA and 0.02% NaN3. Substrate was prepared by 1.0mM PNPG (4-Nitrophenyl α-D-glucopyranoside) in 0.1 mM PBS. 20μL of sample and control (10% DMSO diluted with MeOH) were added to 96-well plates in each well. After 130μL of α-glucosidase enzyme was added to each well and incubated for 10min at room temperature. After the incubation, 50μL substrate was added to each wells and incubated for 30 minutes at 37oC. Using a spectrophotometer, absorbance was measured at 405 nm. The inhibition ratio was calculated with the following equation: [1 - (S-So) / (C-Co)] × 100]. As for So and Co, 0.1 mM PBS were added instead of the substrate.
Molecular Networking - Molecular networking was performed under open access website designed by University of San Diego, GNPS (https://gnps.ucsd.edu/ProteoSAFe/static/gnps-splash.jsp). Data from LC-QTOF MS/MS were converted to mzXML using MS convert software. Converted mzXML files were filtered using MZmine software (Ver. 2.53). After filtration, data were set in to GNPS and molecular networking data was obtained. The molecular networking was created under parameters set as minimum pairs cosine score 0.7 and minimum matched fragment ions 4. The obtained molecular networking data was visualized under cytoscape software (Ver. 3.8.2) for analysis. The molecular networking results can be accessed via the following link: https://gnps.ucsd.edu/ProteoSAFe/status.jsp?task=adcab3fd0c254642881f10189503f4c4.
Quantitative analysis using LC-QTOF MS/MS - Quantitative analysis was performed using data obtained from LC-QTOF MS/MS. Total 10 different concentrations (0.005-100 μg/mL) of compounds mixture (compounds 1, 2, and 5) LC-MS data were obtained and peak intensity of compounds was observed through EIC mode. The obtained data were used for the graph of concentration against peak intensity and the best fit line for each compound was obtained. To observe the high R2 value of the linear equation, data were modified. Once the linear equation was obtained, the peak intensity of three different parts of A. tegmentosum was used in the equation to observe the quantity of each compound.
Statistical analysis - Principal component analysis was performed using data from LC-QTOF MS/MS. EtOAc subfractions mass data were collected four times for every fraction for reliability. Data were transformed from .d file to .cef file using Qualitative analysis (version B.06.00) for the 1st filtering process. Parameters were modified as limit assigned charge states to a maximum of 1, minimum detection level 10000 counts and compound quality score 60. Once .cef files were obtained, Mass Profiler Professional (version 12.1; MPP) program was used. Alignment for retention time tolerance and mass tolerance were set as 0.15 min and 15 ppm respectively. Filter by flags and frequency were set as (20% of total samples, 60% of each parameter) to remove compounds which reduce the reliability and p-value cut-off were set as 0.05. After the 2nd filtering was completed, score plot and loading plot were obtained and analyzed. Pearson’s correlation analysis was analyzed under minitab (version 20.2) using values from quantitative analysis and α-glucosidase inhibition assay of three compounds. Furthermore, Pearson’s correlation analysis was performed to determine the existence of a linear relationship between each variable and response. Pearson’s correlation coefficient has a strong linear relationship between 0.7 and 1.0, a clear linear relationship between 0.3 and 0.7, a weak linear relationship between 0.1 and 0.3, and no or negligible linear relationship between 0.0 and 0.1. The positive and negative correlation are expressed depending on whether the Pearson’s correlation coefficient is positive or negative.
Results and Discussion
The α-glucosidase inhibitory activity results of three different parts of A. tegmentosum on 10-500 μg/mL concentrations were shown (Fig. 1A). To identify chemical constituents in barks of A. tegmentosum, MS chromatograms of the extract and four fractions (n-hexane, EtOAc, n-BuOH and water) were obtained in negative ionization mode using LC-QTOF MS/MS (Fig. 2). From the obtained MS chromatograms, ten major peaks were identified with the expected compounds using MS, MS/MS fragmentation and UV λmax (Table 1).
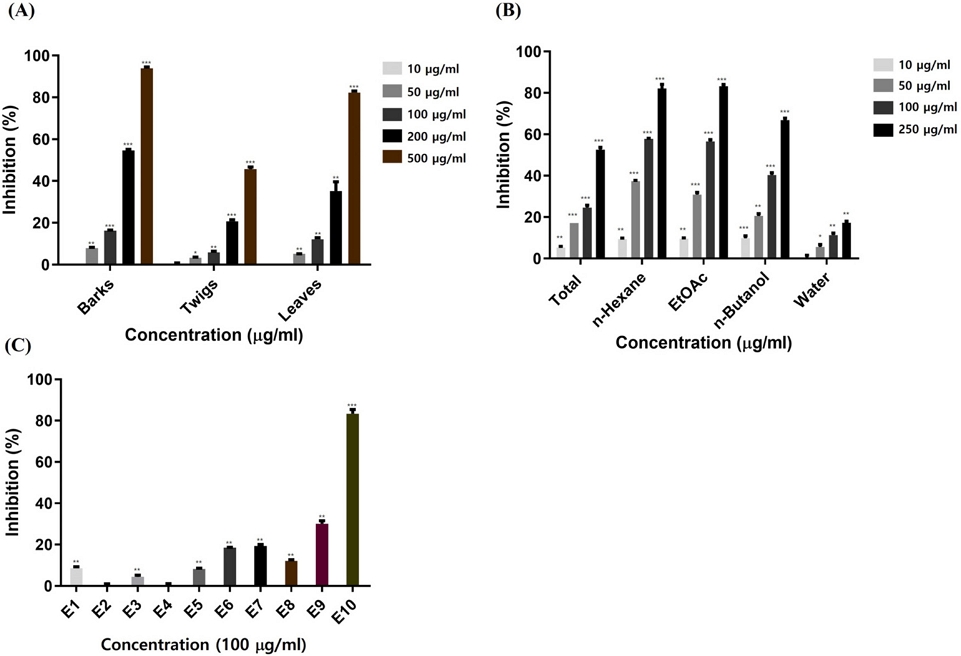
α-Glucosidase inhibitory activities of (A) three different parts from A. tegmentosum, (B) fractions from barks, (C) subfractions of EtOAc fraction from barks, *p < 0.05, **p < 0.01, and ***p < 0.001.
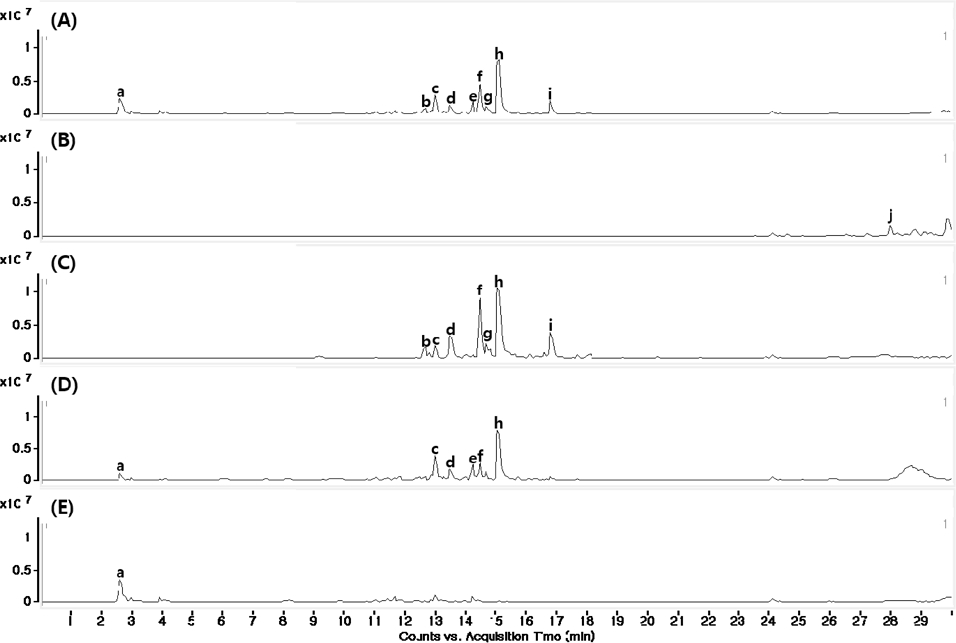
MS chromatograms (negative mode) of A. tegmentosum backs on negative ionization mode; (A) total extract; (B) n-hexane fraction; (C) EtOAc fraction; (D) n-BuOH fraction; (E) H2O fraction.
For the isolation of bioactive compounds on A. tegmentosum, α-glucosidase inhibition assay was used for screening each fraction at four concentrations (10-250 μg/mL) (Fig. 1B). The result showed that EtOAc and n-hexane fractions had the highest inhibition activity, and among two fractions, the EtOAc fraction was selected for further isolation due to higher amount obtained.
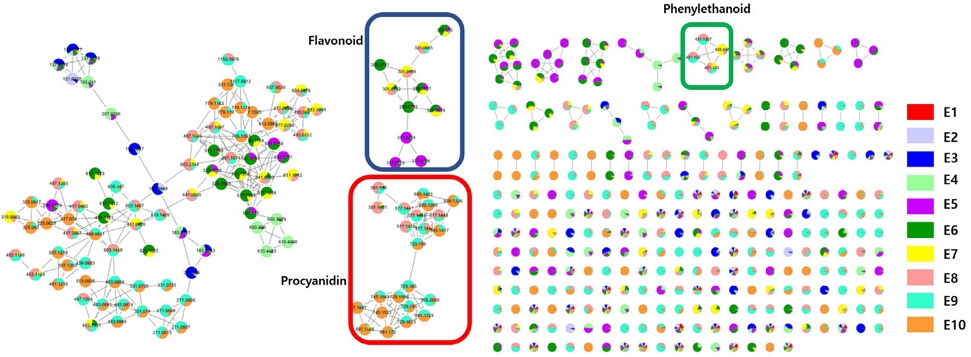
EtOAc fraction was fractionated into ten subfractions (E1-E10) using an open column chromatography. For the isolation of compounds, α-glucosidase inhibition assay was used for screening on each ten subfractions (Fig. 1C). The result showed that E10 from EtOAc fraction exhibited the highest inhibition. Moreover, based on MS chromatogram of fractions from EtOAc fraction, E7 contained most of major expected compounds. Through MS chromatograms, only major compounds were detected, and molecular networking was proceeded to isolate compounds containing galloyl moieties that affect thee α-glucosidase inhibitory activity. Molecular networking on EtOAc subfractions was obtained through Feature Based Molecular Networking (Fig. 3). In total, 432 nodes were observed, and 234 nodes were clustered in 19 clusters. Major compounds were found from nodes and numbered. Four clusters containing major compounds were analyzed, and it was discovered that galloyl tannins, flavonoids, procyanidins and phenylethanoid groups formed four major clusters (Fig. 3). Through analysis with LC-QTOF MS/MS data, most compounds in three clusters (galloyl tannin, procyanidin and phenylethanoid) shared MS/MS fragment with m/z 169 which represented the galloyl moiety. Referring to the α-glucosidase inhibitory activity and molecular networking results, E7 and E10 were selected for target isolation of bioactive compounds from A. tegmentosum.
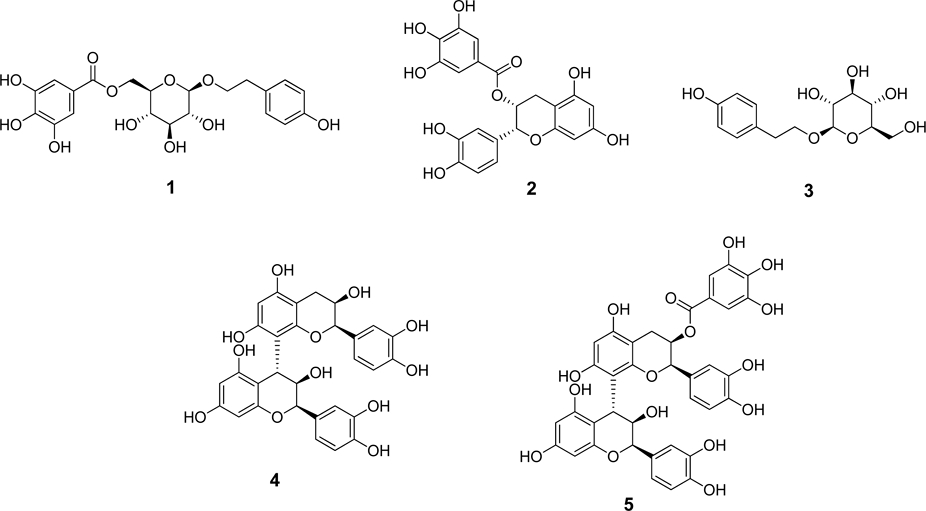
Open column chromatography and semi-prep HPLC were used for isolating major and target compounds. A total of five compounds, 6'-O-galloyl salidroside (1), (-)-epicatechin-3-O-gallate (2), salidroside (3), procyanidin B2 (4) and procyanidin B2-3'-O-gallate (5) were identified using LC-MS data with 1H-NMR, 13C-NMR, HSQC, HMBC spectra and previously reported data (Fig. 4).9,16-19 Compounds 4 and 5 were first reported from A. tegmentousm.
The α-glucosidase inhibition assay on isolated compounds (1-5) was used for screening with 2 in-house compounds, compound 6 (catechin) and compound 7 ((+)-epigallocatechin). As for the positive control, acarbose was used. Based on the result, compounds 1, 2, and 5 showed the highest inhibition activity on 1 mM (Fig. 5A). Three compounds had a common galloyl moiety, suggesting a relationship between galloyl moiety and α-glucosidase inhibition as in the previously reported.6-8 These three compounds (1, 2, and 5) were further tested with different concentrations to calculate IC50 and the results were 980.8 ± 49.3, 249.2 ± 3.8 and 397.4 ± 3.5 μM, respectively (Fig. 5B). Compound 2 showed the highest α-glucosidase inhibition.
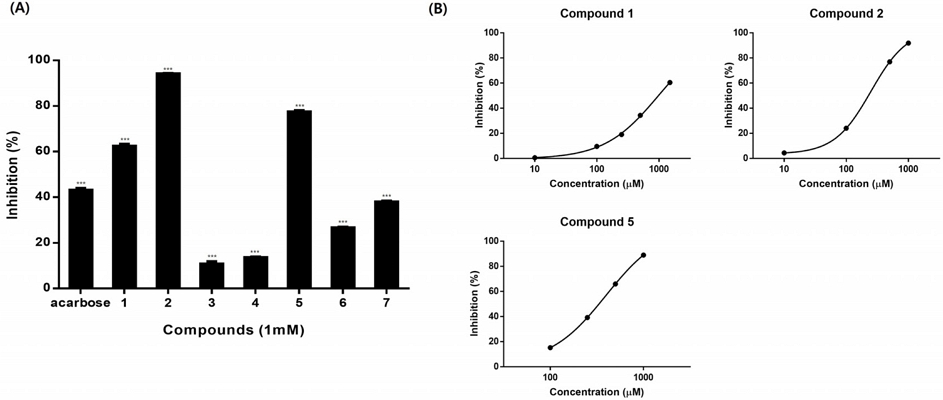
(A) α-Glucosidase inhibitory assay of compounds and positive control (acarbose), *p < 0.05, **p < 0.01, and ***p < 0.001, (B) Sigmoidal plot of compounds 1, 2, and 5.
To identify compounds affecting α-glucosidase inhibitory activity among isolated compounds, a principal component analysis was conducted on EtOAc subfractions based on their α-glucosidase inhibitory activity. The subfractions were color-coded; red for 0~30% inhibitory activity, blue for 30~60% inhibitory activity, green for 60~90% inhibitory activity. The analysis included a score plot and a loading plot using the MPP program (Fig. 6). As a result, group 1 contained fractions with less than 60% α-glucosidase inhibitory percentage, while group 2 with higher than 60% α-glucosidase inhibitory percentage. Based on the loading plot, only compound 5 was detected and other compounds were not. One of the factors might be on filtering process, other compounds were not distributed in all subfractions and compounds with less than 20% of samples contained were removed therefore compounds were not detected in loading plot. However, compound 5 was detected and located on the left side of the graph, suggesting its influence α-glucosidase inhibitory activity. Furthermore, quantitative analysis was conducted to determine compounds affecting the α-glucosidase inhibitory activity, which was not observed through principal component analysis. The quantities of compounds 1, 2, and 5 in different parts of A. tegmentosum was calculated using LC-MS. Utilizing linear regression equations, the quantities of these three compounds in different parts were calculated, revealing the barks contained higher levels than the other two parts (Table 2). This finding corresponds to the α-glucosidase inhibition results of different parts, where barks exhibited the highest inhibition. To further analyze the relationship between the quantities of these three compounds and α-glucosidase inhibition, Pearson correlation analysis was performed (Table 3). The results showed a strong correlation on compounds 2 and 5, and compound 1 exhibited a moderate correlation with α-glucosidase inhibition. The sum of three compounds showed a moderate correlation with α-glucosidase inhibition, which overall indicated that these three compounds might be potential inhibitors on α-glucosidase.
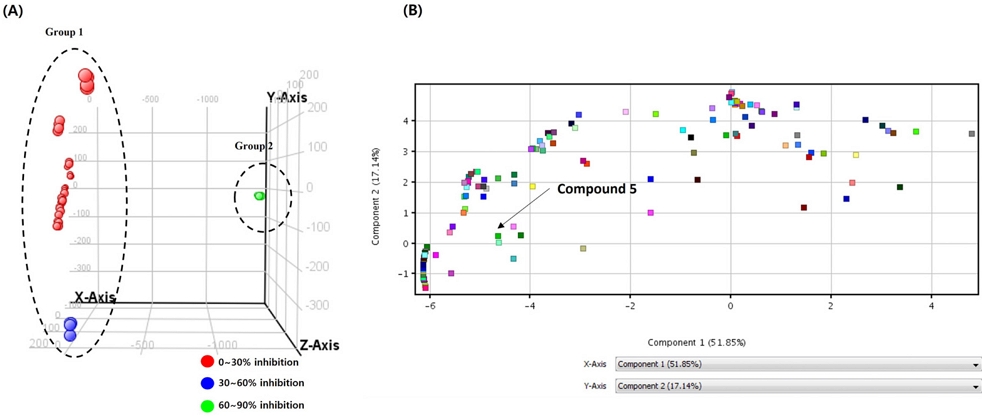
(A) Score plot and (B) loading plot from principal component analysis of EtOAc subfractions and α-glucosidase inhibitory activities.

Pearson correlation coefficient on the quantity of compounds 1, 2, and 5 against α-glucosidase inhibition
In summary, this study was to find compounds with potent α-glucosidase inhibitory effects from A. tegmentosum. The EtOAc fraction of A. tegmentosum barks displayed the highest α-glucosidase inhibition, leading to further isolation. Molecular networking revealed clusters with m/z 169 MS/MS fragment, indicating a galloyl moiety presence and guiding targeted isolation. Five compounds were isolated, and compounds 1, 2, and 5 displayed the strongest α-glucosidase inhibitory activity. Quantitative analysis demonstrated that compounds 1, 2, and 5, which correlated with α-glucosidase inhibition, were enriched in the bark. These results confirmed the role of the galloyl moiety and the antidiabetic drug discovery potential of A. tegmentosum bark extracts and compounds.
Acknowledgments
This research was supported by the National Research Foundation of Korea grants funded by the Korean Government (NRF-2019R1A6A1A03031807 and NRF-2021R1A2C1093814) and the MSIT (Ministry of Science and ICT), Korea under the ITRC(Information Technology Research Center) support program (IITP-2023-RS-2023-00258971).
Conflicts of Interest
The authors declare that they have no conflicts of interest.
References
-
Galicia-Garcia, U.; Benito-Vicente, A.; Jebari, S.; Larrea-Sebal, A.; Siddiqi, H.; Uribe, K. B.; Ostolaza, H.; Martín, C. Int. J. Mol. Sci. 2020, 21, 6275.
[https://doi.org/10.3390/ijms21176275]

-
Shaw, J. E.; Sicree, R. A.; Zimmet, P. Z. Diabetes Res. Clin. Pract. 2010, 87, 4-14.
[https://doi.org/10.1016/j.diabres.2009.10.007]

-
Hossain, U.; Das, A. K.; Ghosh, S.; Sil, P. C. Food Chem. Toxicol. 2020, 145, 111738.
[https://doi.org/10.1016/j.fct.2020.111738]

-
Sohrabi, M.; Reza Binaeizadeh, M.; Iraji, A.; Larijani, B.; Saeedi, M.; Mahdavi, M. RSC Adv. 2022, 12, 12011-12052.
[https://doi.org/10.1039/D2RA00067A]

-
Dong, Y.; Sui, L.; Yang, F.; Ren, X.; Xing, Y.; Xiu, Z. Food Chem. 2022, 394, 133561.
[https://doi.org/10.1016/j.foodchem.2022.133561]

-
Cao, J.; Yan, S.; Xiao, Y.; Han, L.; Sun, L.; Wang, M. Food Chem. 2022, 367, 129846.
[https://doi.org/10.1016/j.foodchem.2021.129846]

-
Kokila, N. R.; Mahesh, B.; Ramu, R.; Mruthunjaya, K.; Bettadaiah, B. K.; Madhyastha, H. J. Biomol. Struct. Dyn. 2023, 41, 10642-10658.
[https://doi.org/10.1080/07391102.2022.2156923]

-
Oboh, G.; Ogunsuyi, O. B.; Ogunbadejo, M. D.; Adefegha, S. A. J. Food Drug Anal. 2016, 24, 627-634.
[https://doi.org/10.1016/j.jfda.2016.03.003]

-
Lee, K. J.; Song, N. Y.; Oh, Y. C.; Cho, W. K; Ma, J. Y. J. Anal. Methods Chem. 2014, 2014, 150509.
[https://doi.org/10.1155/2014/150509]

-
Hou, Y.; Jin, C.; An, R.; Yin, X.; Piao, Y.; Yin, X.; Jin, L.; Zhang, C. Biochem. Syst. Ecol. 2019, 83, 1-3.
[https://doi.org/10.1016/j.bse.2018.12.006]

-
Hwang, J.-W.; Park, C. H.; An, H.-Y.; Jang, Y.-W.; Kang, H.; Lee, S.-G. J. Plant Biotechnol. 2022, 49, 339-346.
[https://doi.org/10.5010/JPB.2022.49.4.339]

-
Park, J.-S.; Kwon, E.; Kim, Y.-S.; Kim, S.-M.; Kim, D.-S.; Jang, J.-J.; Yun, J.-W.; Kang, B.-C. Front. Pharmacol. 2021, 12, 687261.
[https://doi.org/10.3389/fphar.2021.687261]

-
Cho, E. K.; Jung, K. I.; Choi, Y. J. J. Korean Soc. Food Sci. Nutr. 2015, 44, 1785-1792.
[https://doi.org/10.3746/jkfn.2015.44.12.1785]

-
Rivera-Mondragón, A.; Tuenter, E.; Ortiz, O.; Sakavitsi, M. E.; Nikou, T.; Halabalaki, M.; Caballero-George, C.; Apers, S.; Pieters, L.; Foubert, K. Phytochemistry 2020, 177, 112438.
[https://doi.org/10.1016/j.phytochem.2020.112438]

-
Kang, K. B.; Park, E. J.; da Silva, R. R.; Kim, H. W.; Dorrestein, P. C.; Sung, S. H. J. Nat. Prod. 2018, 81, 1819-1828.
[https://doi.org/10.1021/acs.jnatprod.8b00292]

-
Khallouki, F.; Haubner, R.; Hull, W. E.; Erben, G.; Spiegelhalder, B.; Bartsch, H.; Owen, R. W. Food Chem. Toxicol. 2007, 45, 472-485.
[https://doi.org/10.1016/j.fct.2006.09.011]

-
He, F.; Chen, L.; Liu, Q.; Wang, X.; Li, J.; Yu, J. Molecules 2018, 23, 3353.
[https://doi.org/10.3390/molecules23123353]

-
Xiong, W.; Wu, L.; Hu. J. W.; Ji, X. Y.; Fu, J. P.; Zhang, J. Y.; Si, C. L.; Kim, J. K.; Li, X. H. Chem. Nat. Compd. 2018, 54, 1009-1011.
[https://doi.org/10.1007/s10600-018-2537-2]

-
Tarascou, I.; Barathieu, K.; Simon, C.; Ducasse, M. A.; André, Y.; Fouquet, E.; Dufourc, E. J.; de Freitas, V.; Laguerre, M.; Pianet, I. Magn. Reson. Chem. 2006, 44, 868-880.
[https://doi.org/10.1002/mrc.1867]

